Site Logs
- How to check Site Apache access logs through the cloudpanzer website?
- How to check Site Apache error logs through the cloudpanzer website?
- How to check Site Nginx access logs through the cloudpanzer website?
- How to check Site Nginx Error log through the cloudpanzer website?
- How to navigate site logs?
- How to check Site PHP logs through the cloudpanzer website?
How to check Site Apache access logs through the cloudpanzer website?
As a website owner or developer, it's important to monitor your Apache access logs regularly. Apache is one of the most widely used web servers on the internet, and its access logs contain valuable information about the traffic to your website.
Follow the steps below to check the site log Apache access
Navigate to the Site Logs
(Use this link to view How to Navigate
5: Click on the Nginx Error button then click on the get log button to see the logs.
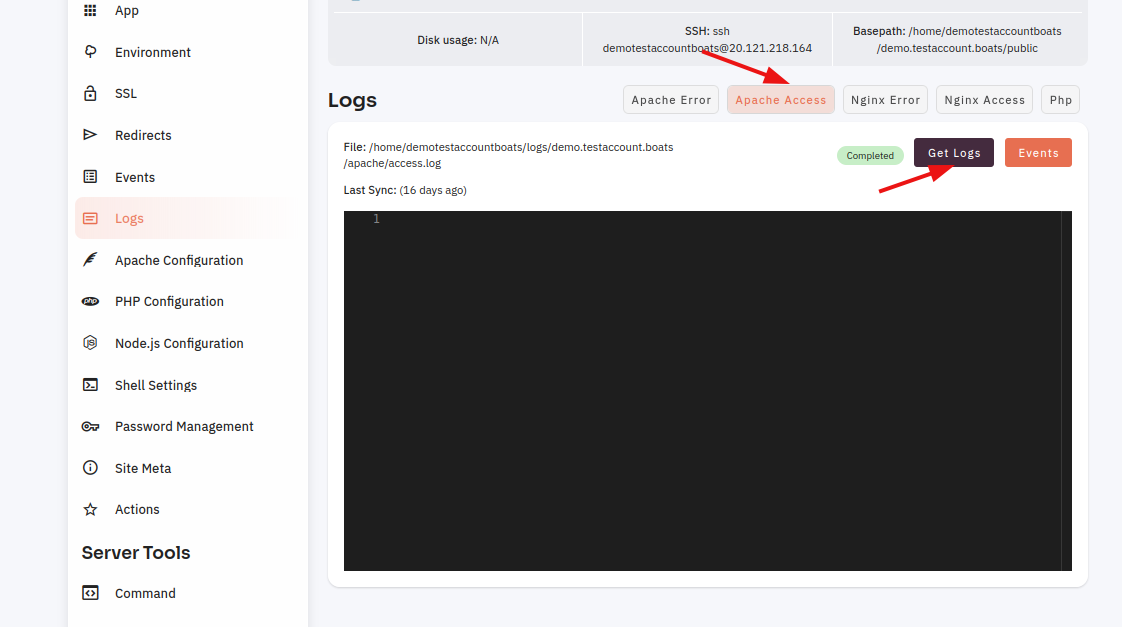
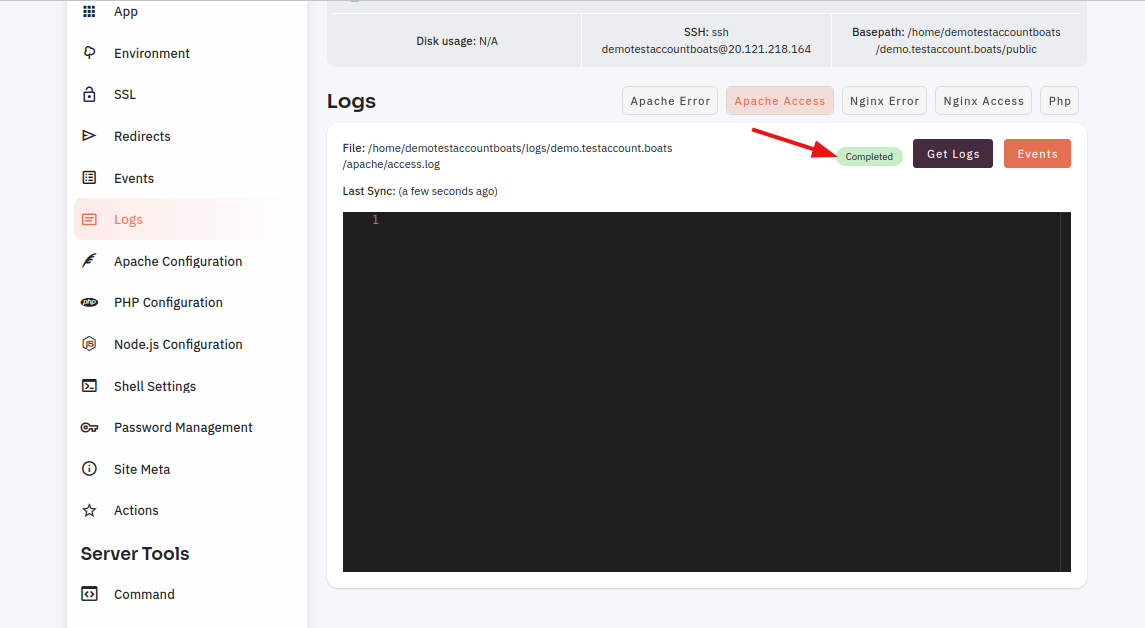
Here, you can see the Complete successfully.
How to check Site Apache error logs through the cloudpanzer website?
If you are a website owner or a developer, it is important to monitor the Apache error logs of your website regularly. Apache is one of the most widely used web servers on the internet and its error logs contain valuable information about the performance and health of your website.
Follow the steps below to check the site Apache error logs.
Navigate to the Site Logs
(Use this link to view How to Navigate
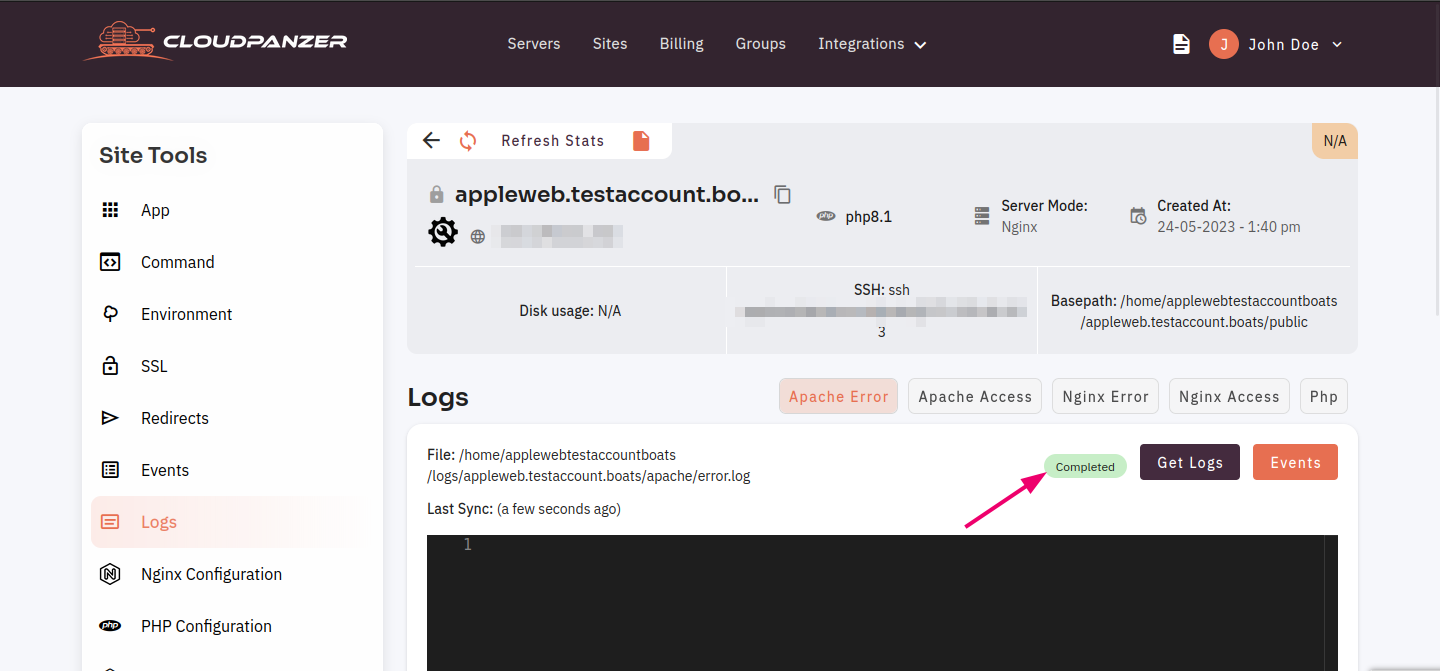
5: Click on the Apache Error button then click on the Get Logs button to see the logs.
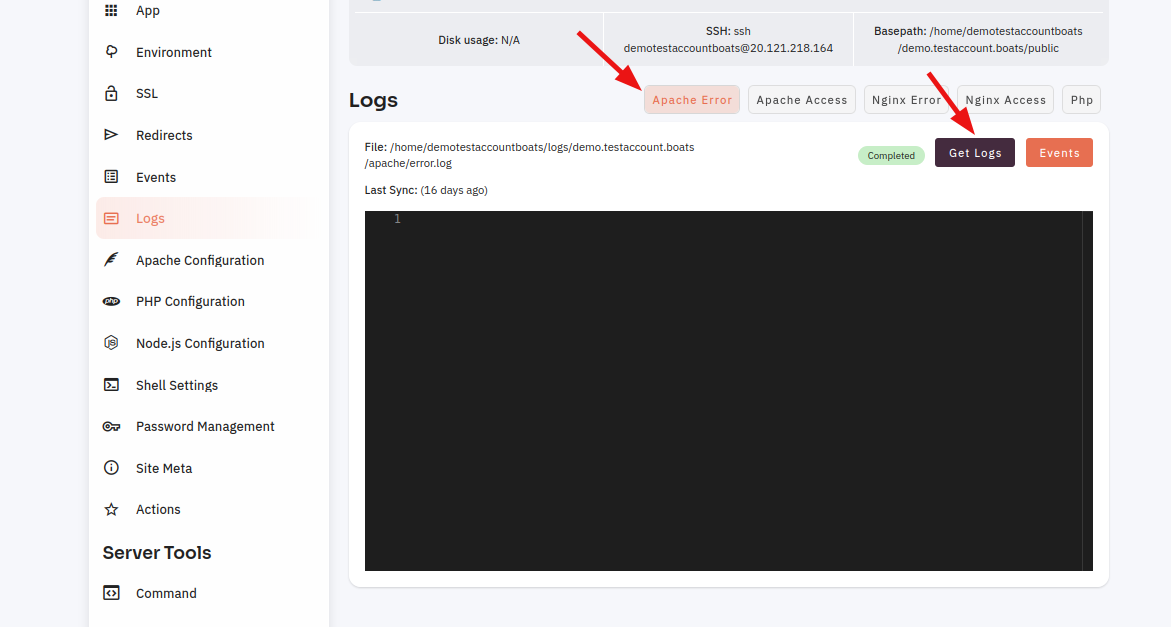
Here, you can see the Complete successfully.
How to check Site Nginx access logs through the cloudpanzer website?
By regularly checking the Nginx access logs for your site, you can identify any issues that may be affecting the performance of your server. It helps you to identify and fix problems before they become serious issues, and ensure that your site is running smoothly for your users.
Tutorial :
You can watch the Video or Continue reading the post.
Follow the steps below to check the site log Nginx error
Navigate to the Logs
(Use this link to view How to Navigate
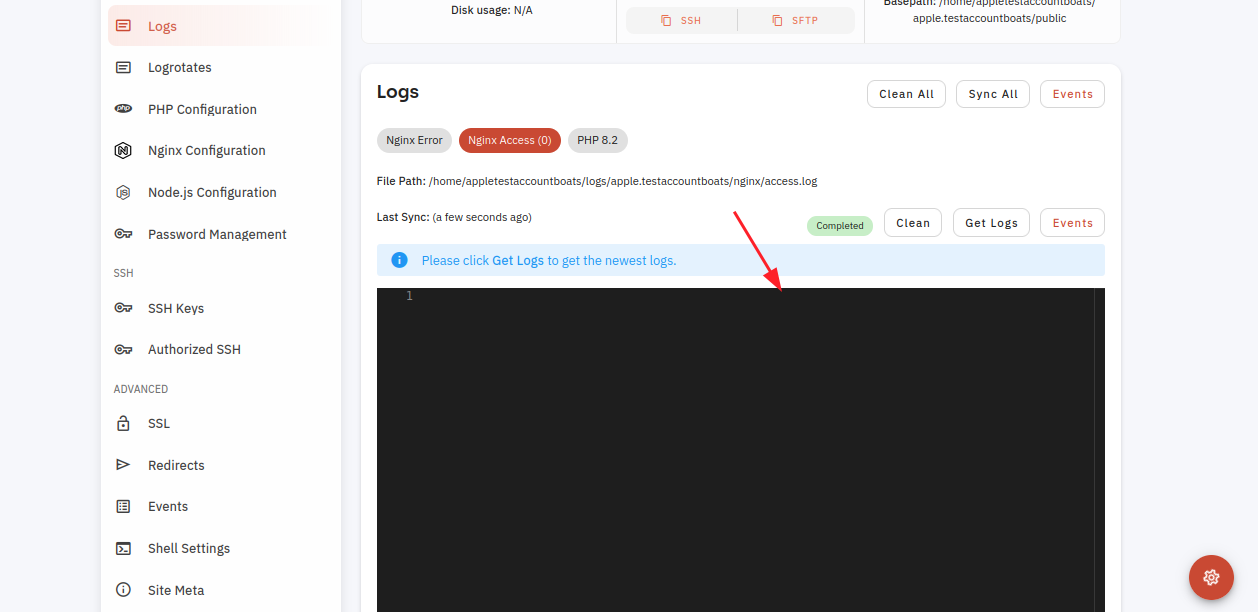
5: Select the Nginx Access option.
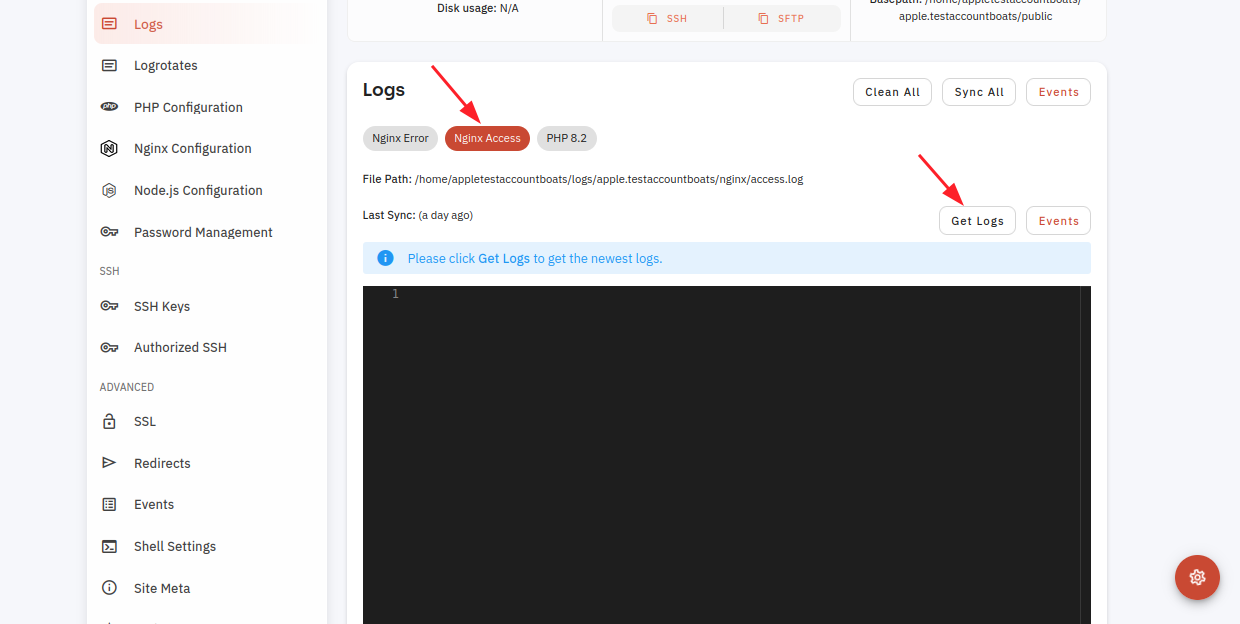
Here you can Check Nginx Access logs Successfully.
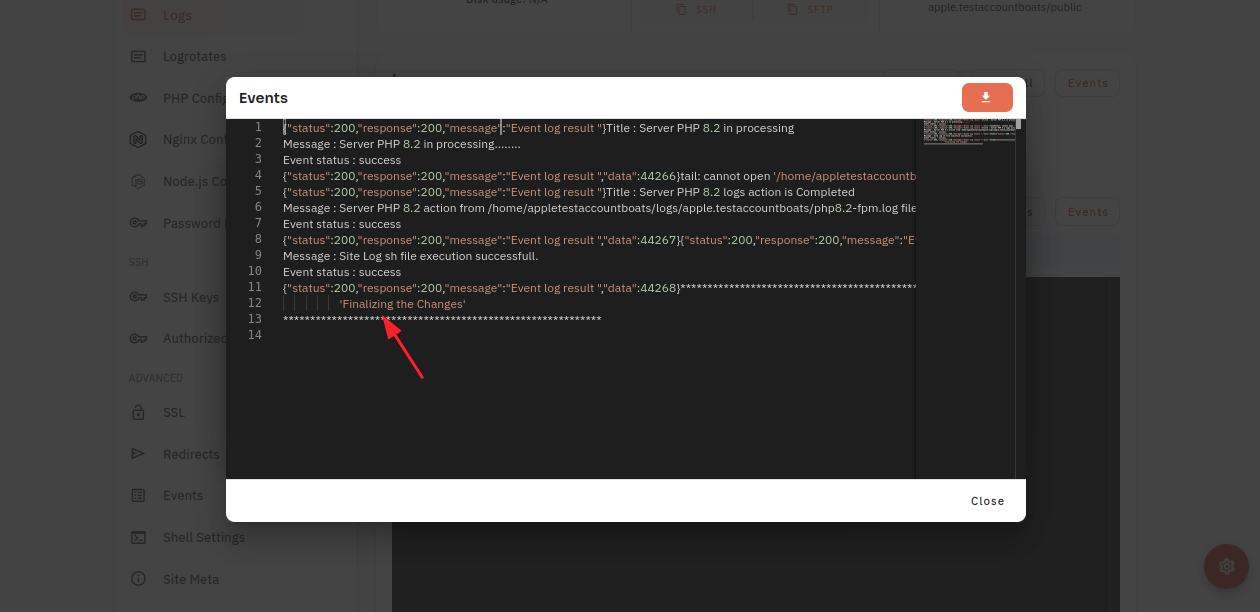
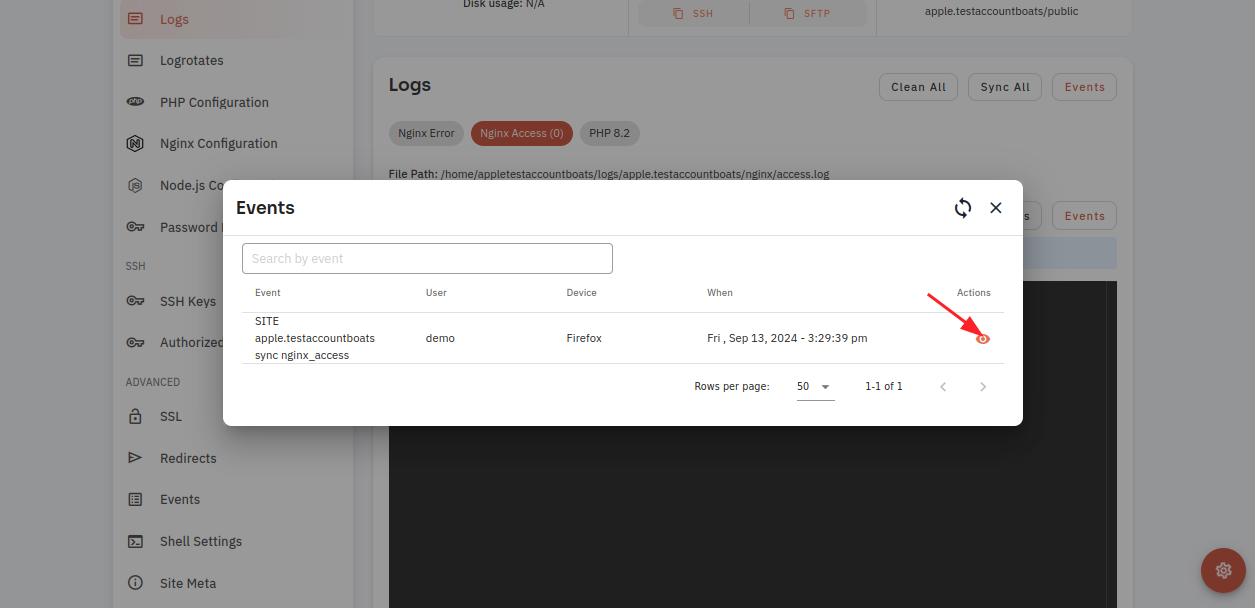
6 Click on the Events Button.
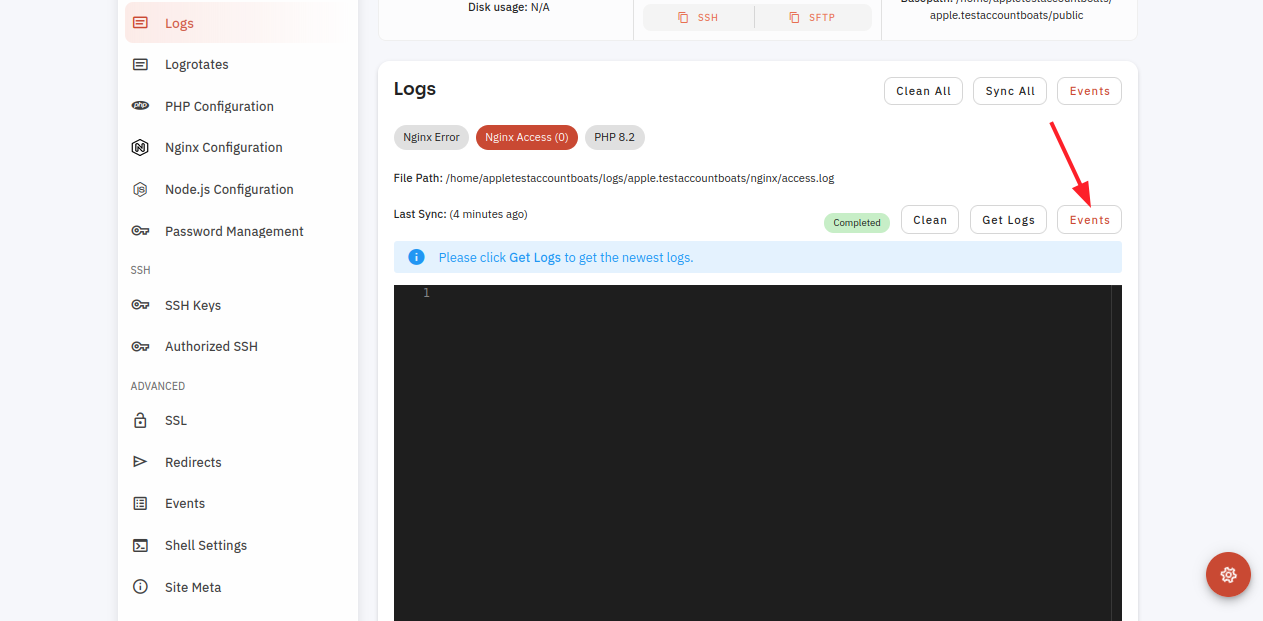
7. Click on the Eye Icon.
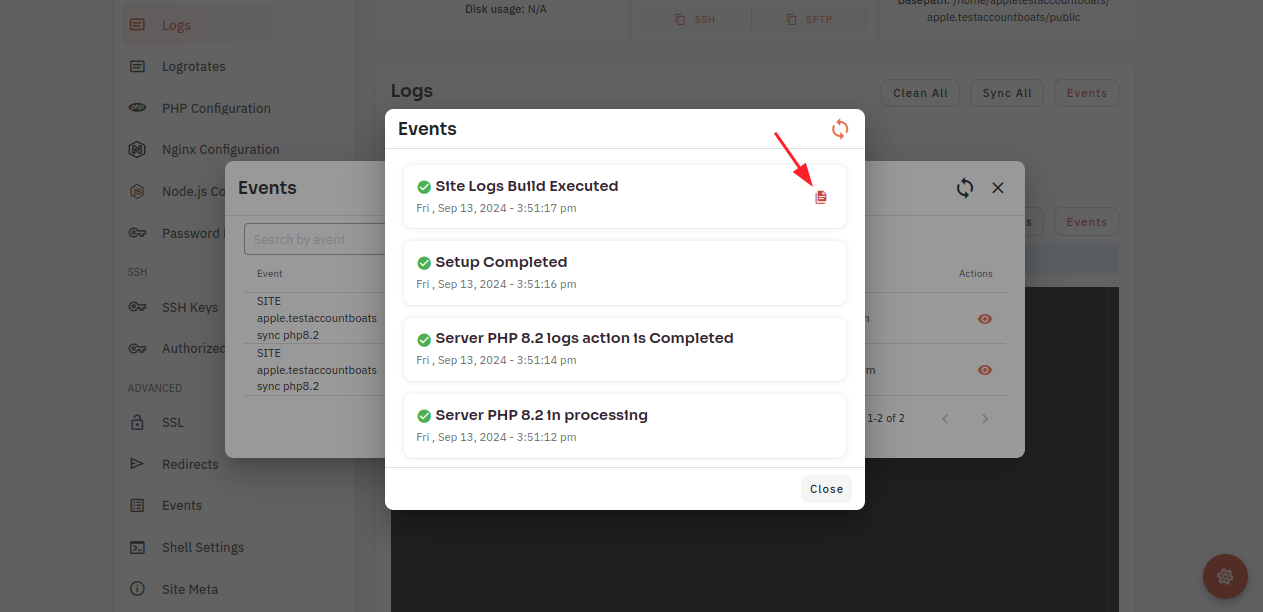
8. Click on the file icon.
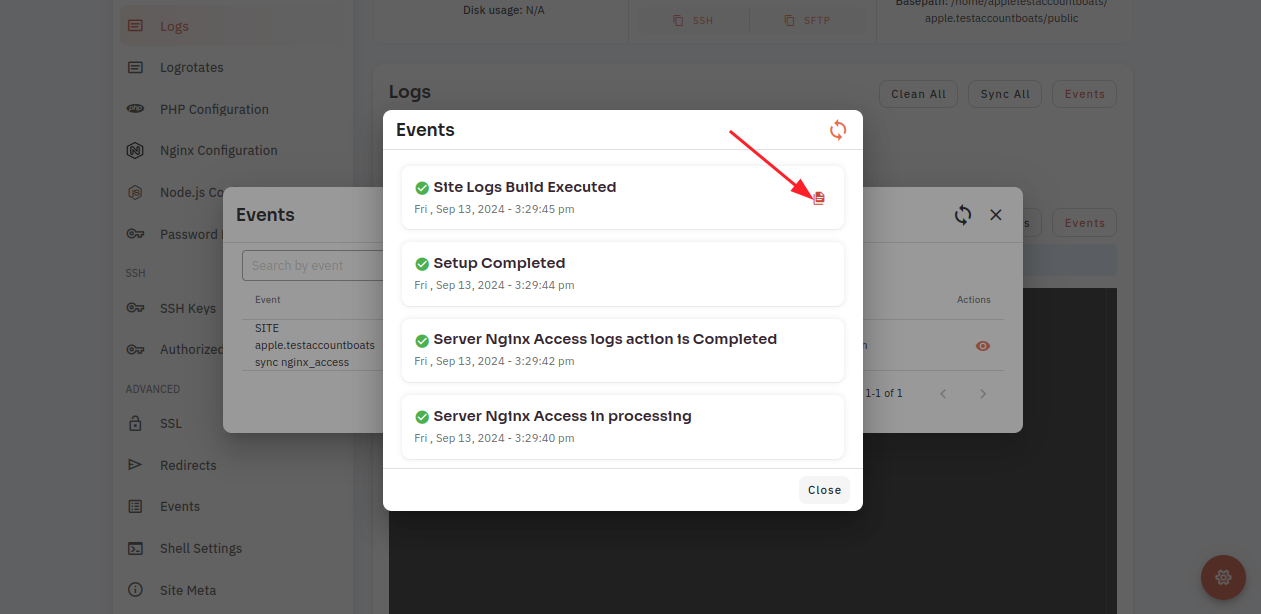
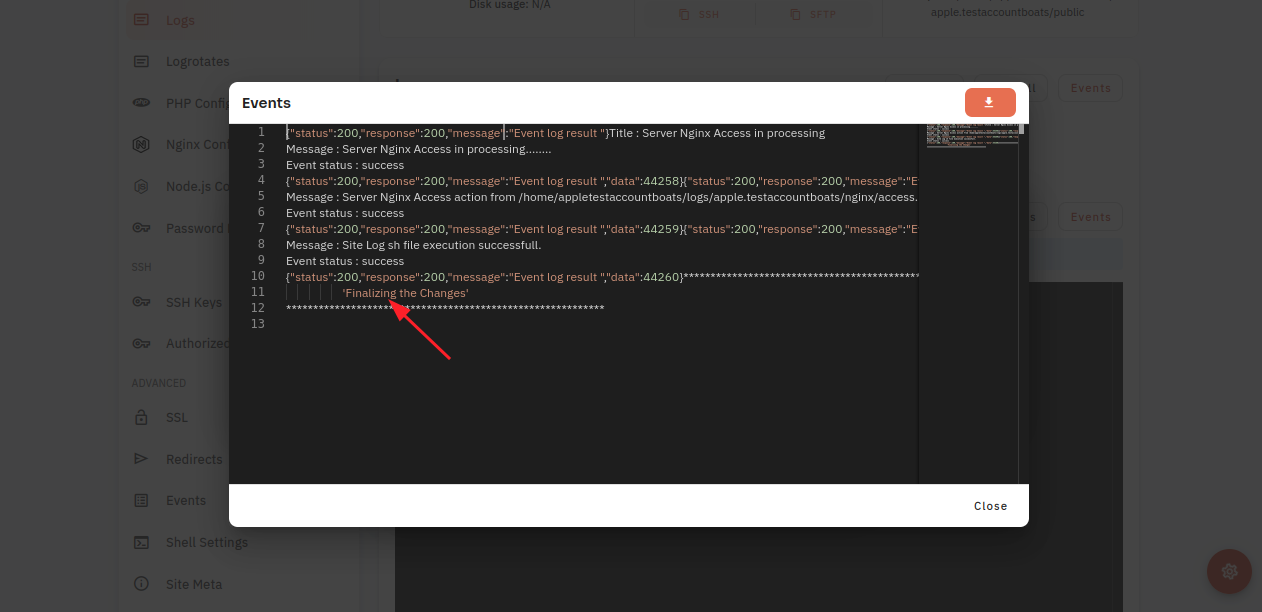
Here, you can see the event data.
How to check Site Nginx Error log through the cloudpanzer website?
When managing a website, it is important to regularly check the site log for any errors. This can help you identify and troubleshoot issues with your site, as well as optimize its performance.
Prerequisites :
You must have an Active Server and Active Site. You can jump to the tutorial section if the above conditions are correct, or first follow the links below to set up the prerequisites.
How to install a Server
How to Setup a Site
Tutorial :
You can watch the Video or Continue reading the post.
Follow the steps below to check the site log Nginx error
Navigate to the Logs
(Use this link to view How to Navigate
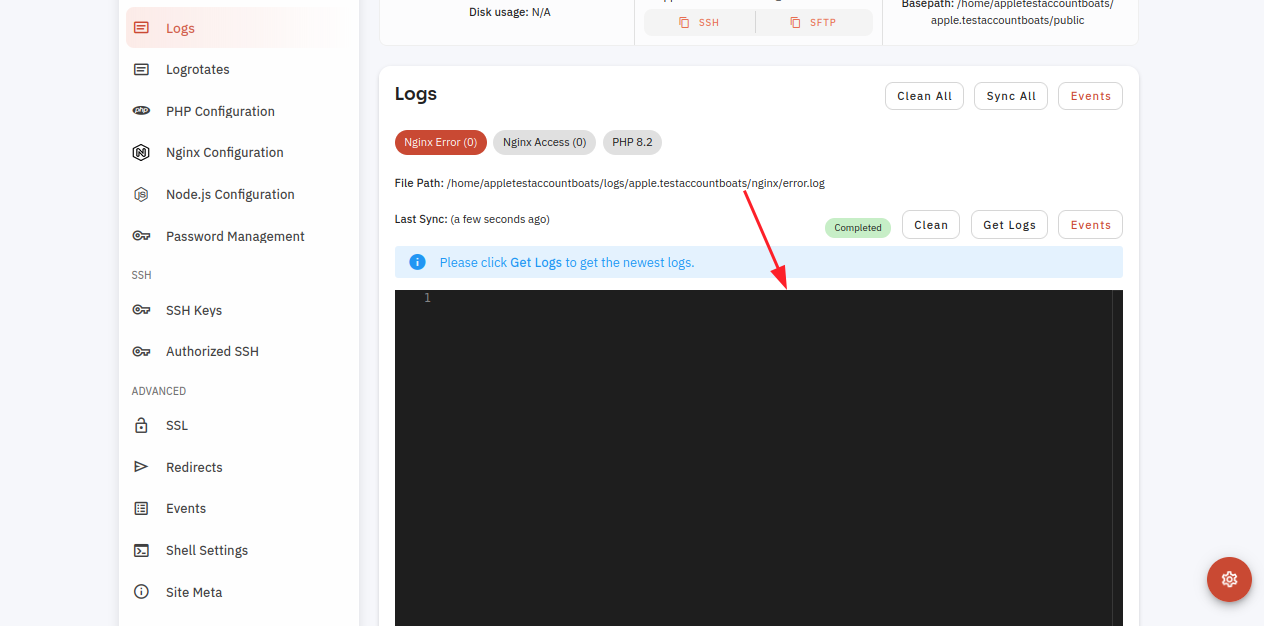
5: Click on the Nginx Error button then click on the get log button to see the logs.
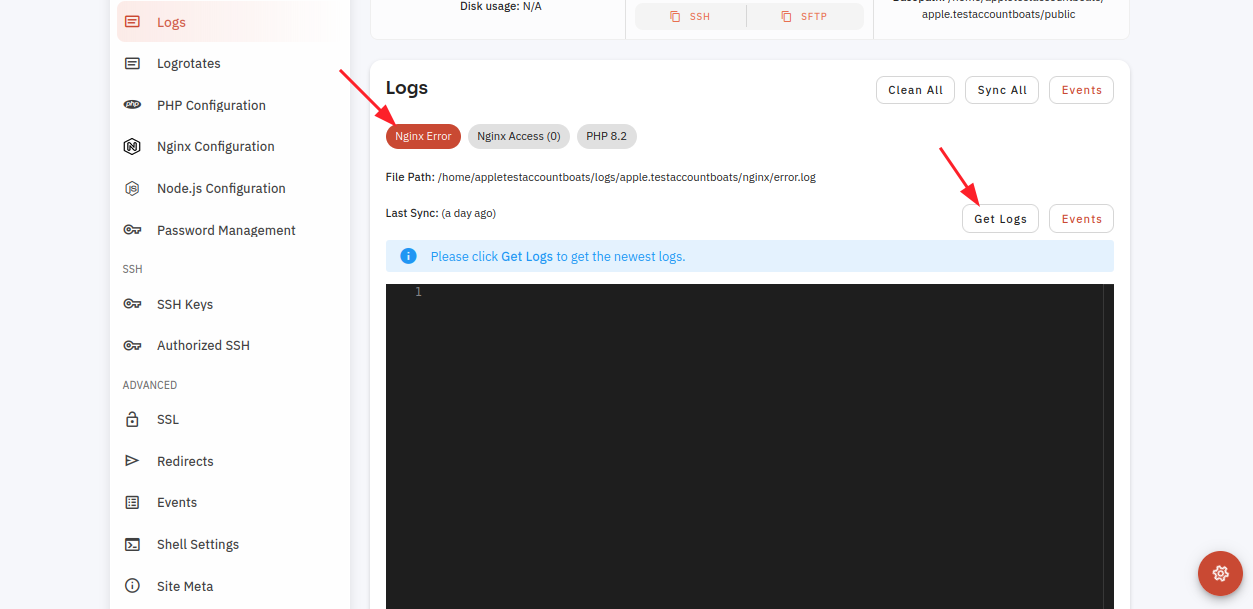
Here, you can see the log data.
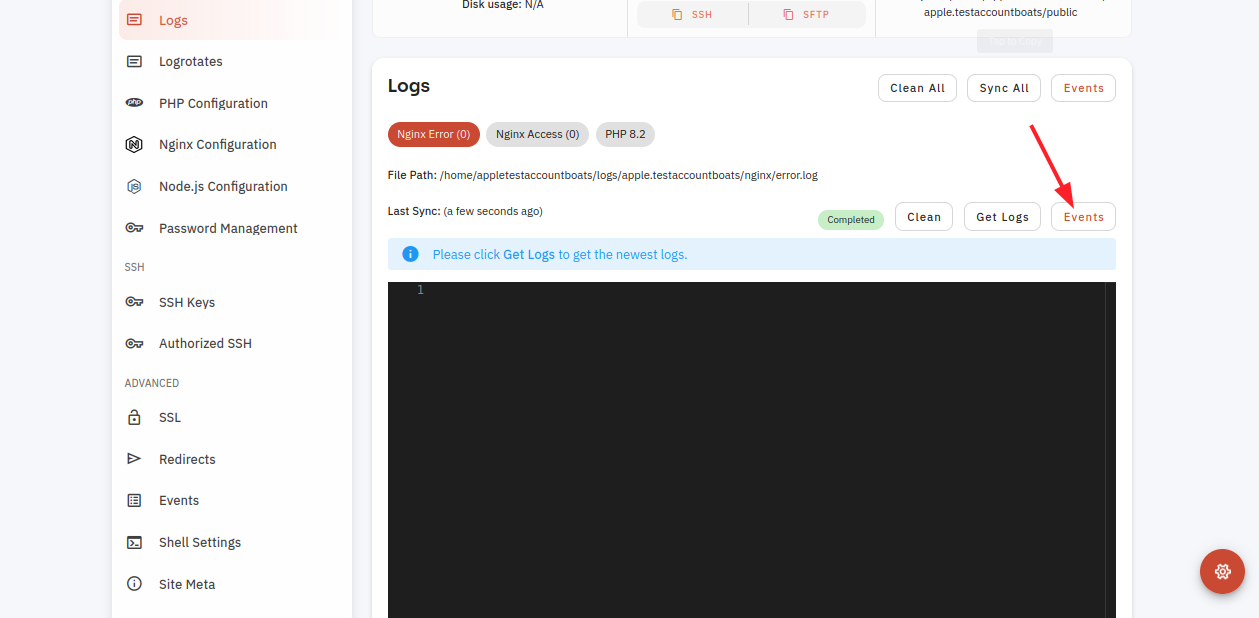
6 Click on the Events Button.
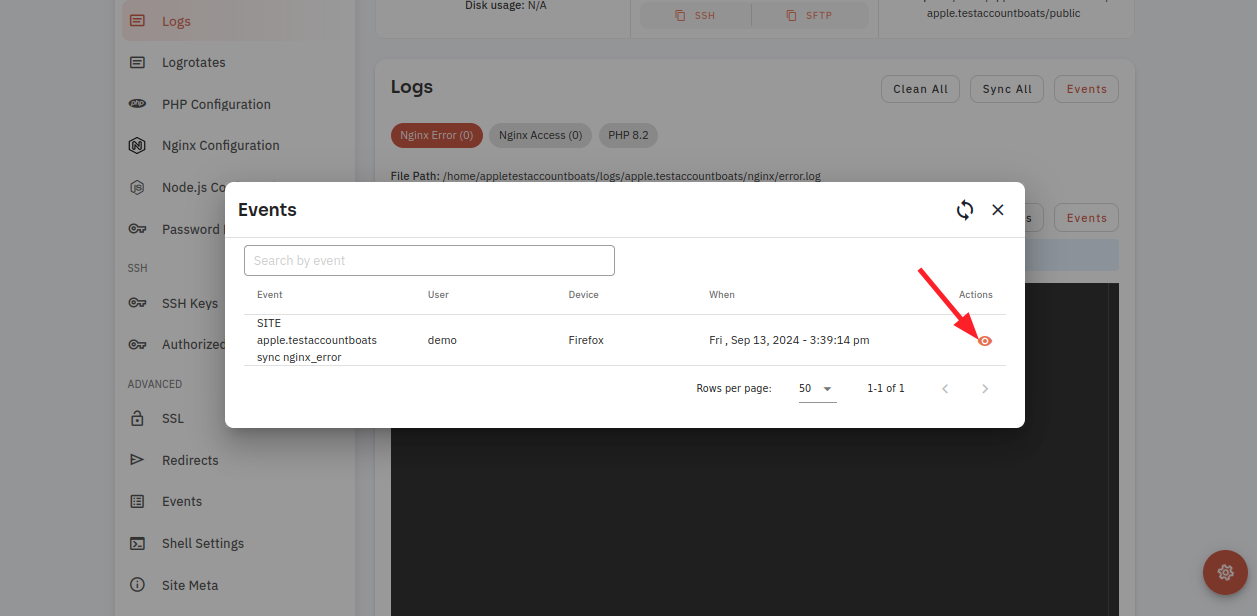
7. Click on the Eye Icon.
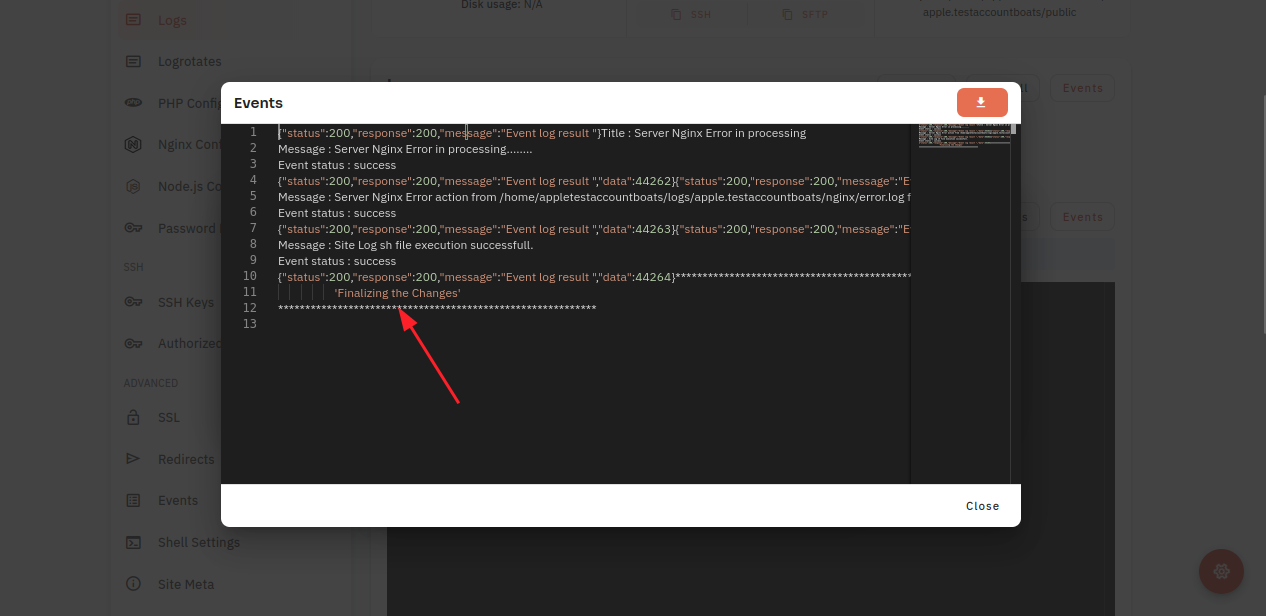
8. Click on the file icon.

Here, you can see the event data.
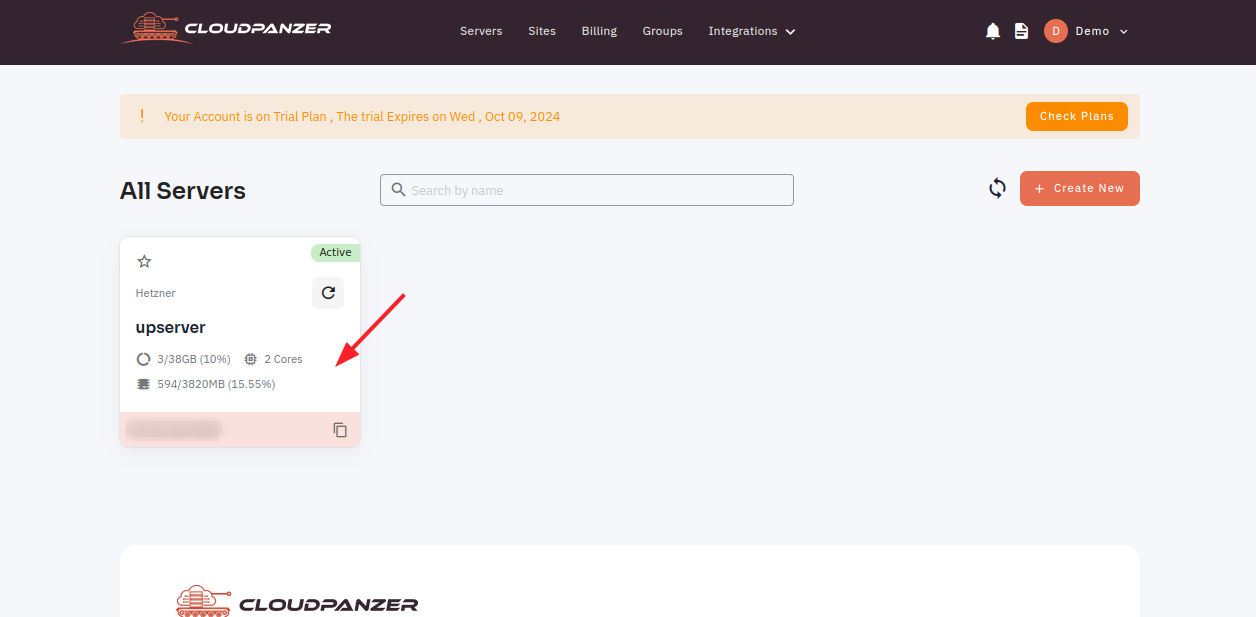
How to navigate site logs?
1: Once you are logged in, look for a "Server" and click on it.
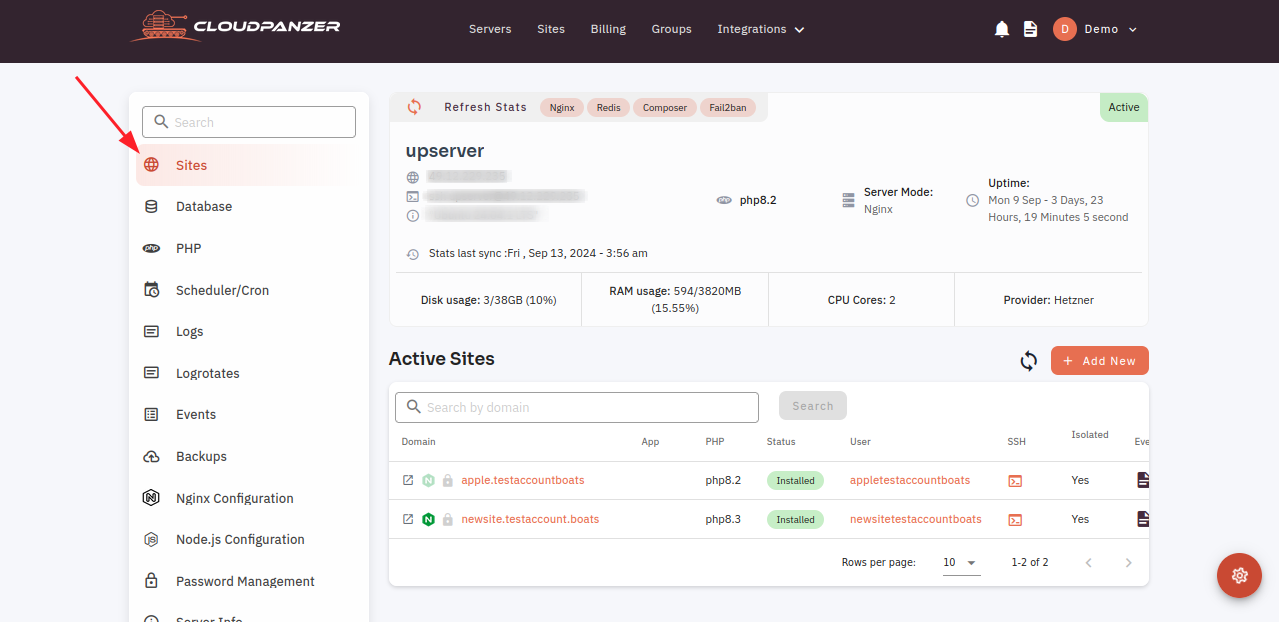
2. Select the Sites option.
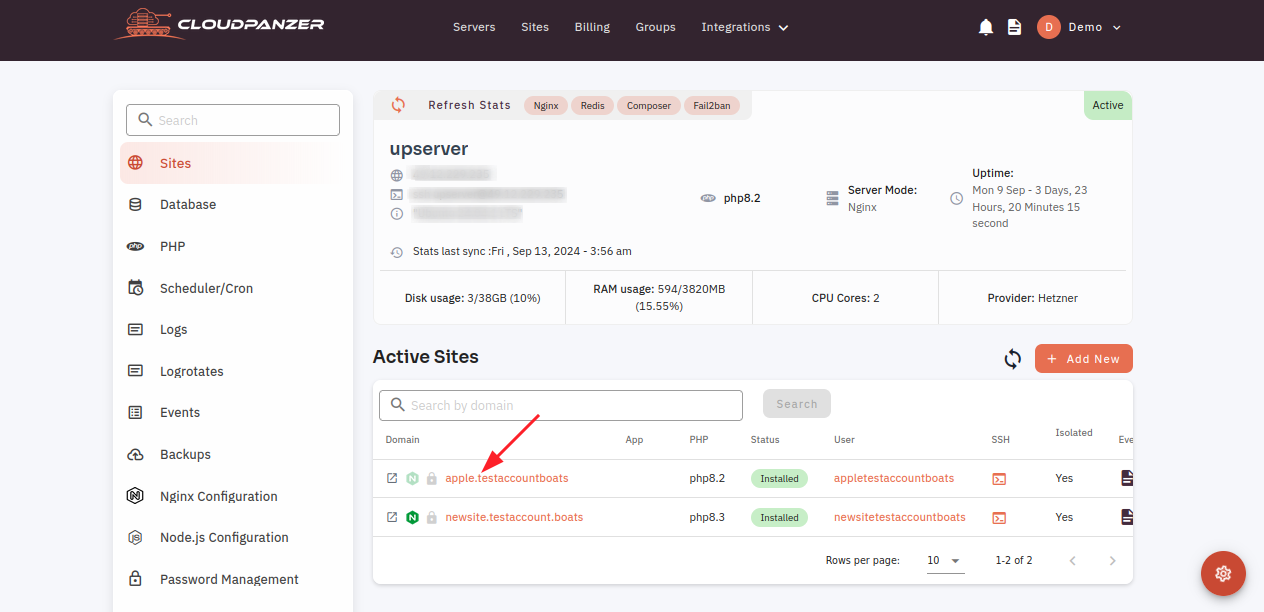
3. Select the Active site.
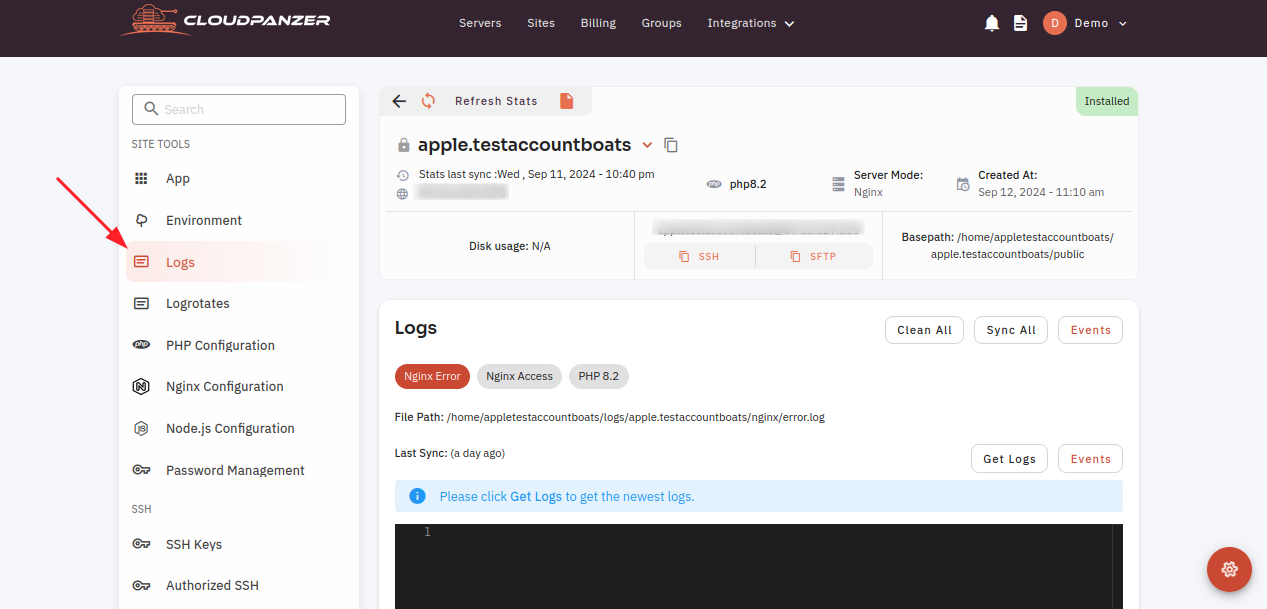
4. Select the Logs Options.
How to check Site PHP logs through the cloudpanzer website?
PHP is a popular server-side scripting language that is widely used for creating dynamic web applications. It is essential to keep track of errors and other important events that occur during the execution of a PHP script. This can be done using PHP logs, which provide a record of all the errors and other events that occur during the execution of a PHP script.
Tutorial :
You can watch the Video or Continue reading the post.
Follow the steps below to check the site log PHP
Navigate to the Logs
(Use this link to view How to Navigate
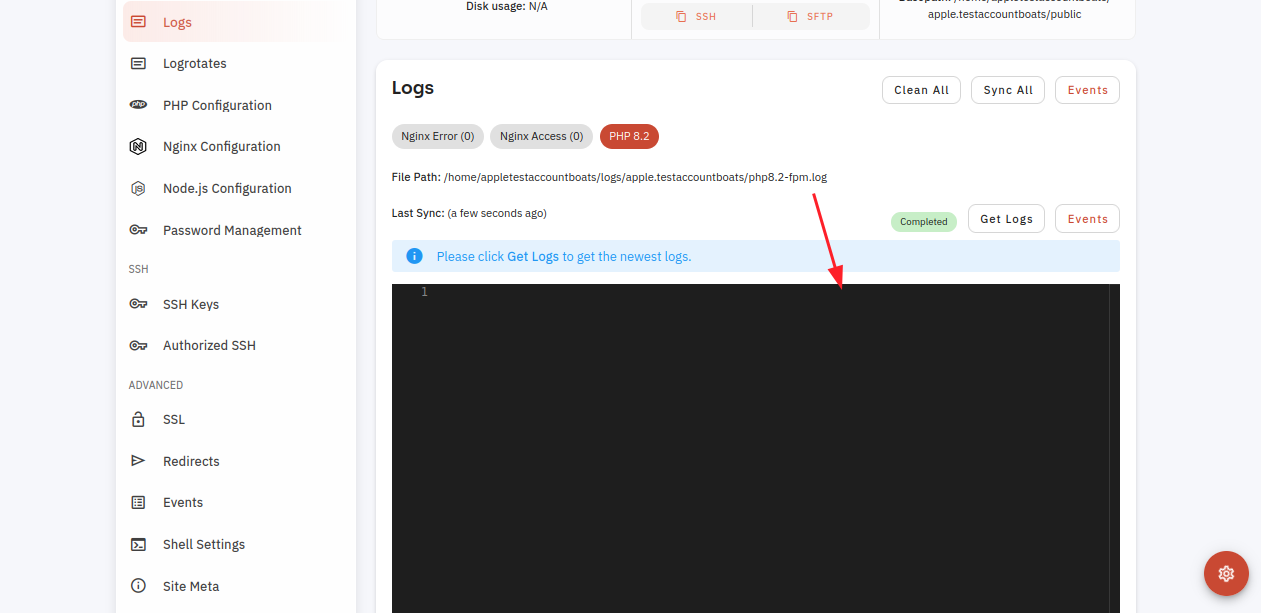
5: Select the PHP option and click on the Get Log button.
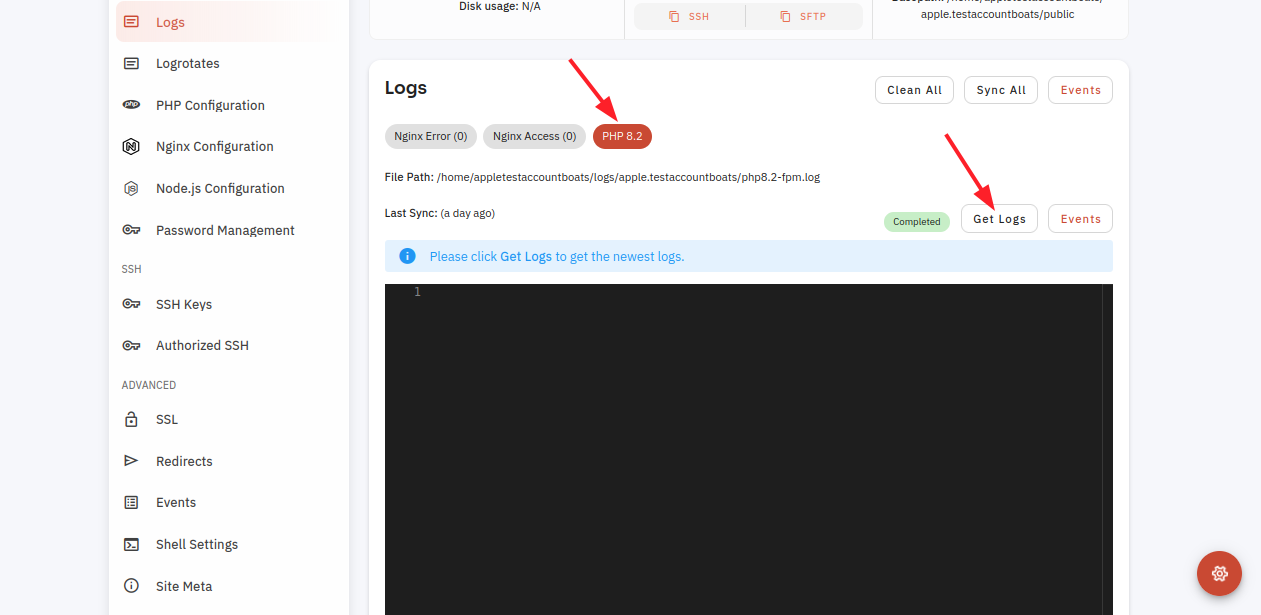
Here you can Check Nginx Access logs Successfully.
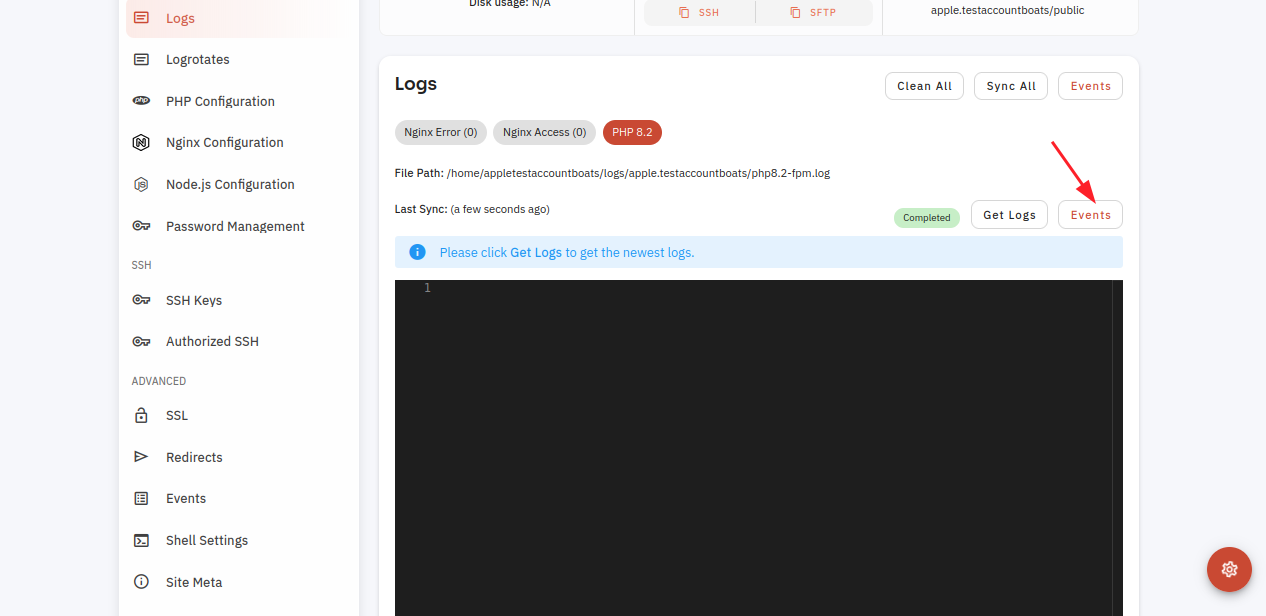
6 Click on the Events Button.
7. Click on the Eye Icon.
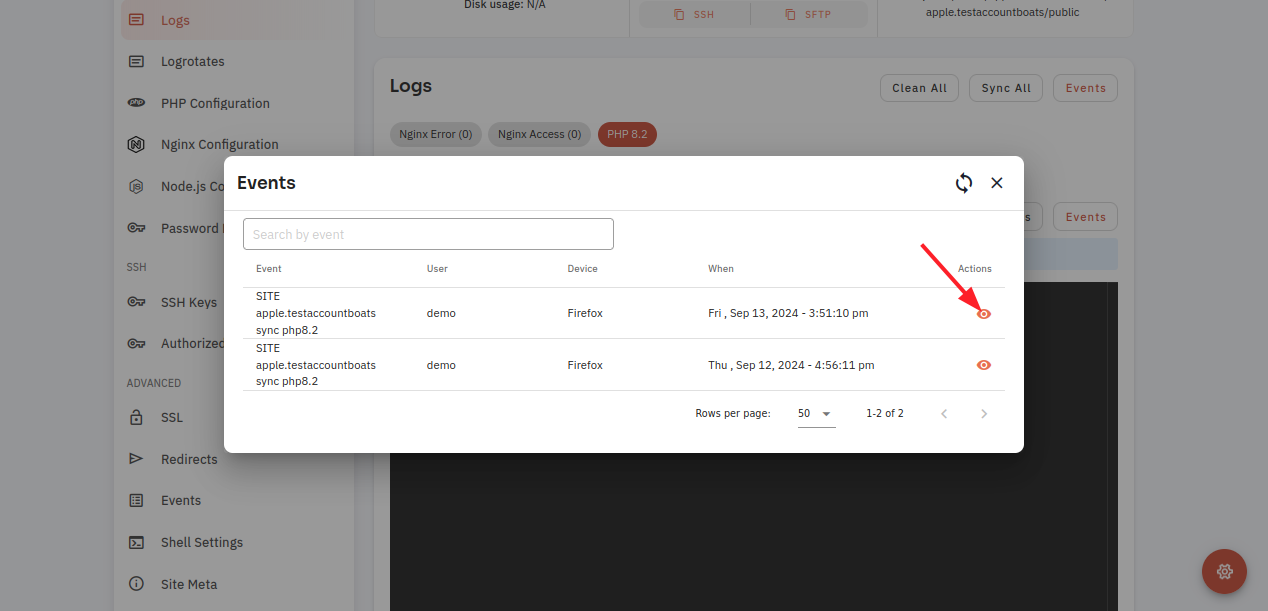
8. Click on the file icon.
Here, you can see the event data.